Target Mapping to Prevent Slips, Trips and Falls (STFs)
Workplaces everywhere are susceptible to slip and fall injuries. In 2018, out of the 900,380 nonfatal work injuries resulting in days away from work, 27% were related to slips, trips, and falls1. What is most surprising is that slips, trips and falls continue to be a top injury cause regardless of how much we promote awareness. Let’s take a look at another method to reduce these injuries.
As we prepare for winter, the season when STFs are most prevalent, an intentional performance check should be done. Are your safety performance goals being met? Did you hit your goal of no slips and falls this year? If not, perhaps a gap exists between your expectations and activities. Or maybe some efforts need to be reprioritized. For instance, while communication campaigns about personal awareness are common, they do not correct any site conditions that can lead to these injuries.
To improve prevention effectiveness and participation, incident and hazard mapping should be used to supplement your approach.2,3 Mapping itself is not a new technique, but it is often underutilized in workplace safety. Maps help people understand where incidents have occurred and where the conditions may be more hazardous. They can help align preventative action plans, resources, and budgets. They engage people in the safety culture to better recognize hazards and understand prevention. New hires can identify and locate hazards in their work areas, and safety committees or improvement teams can do the same facility wide.
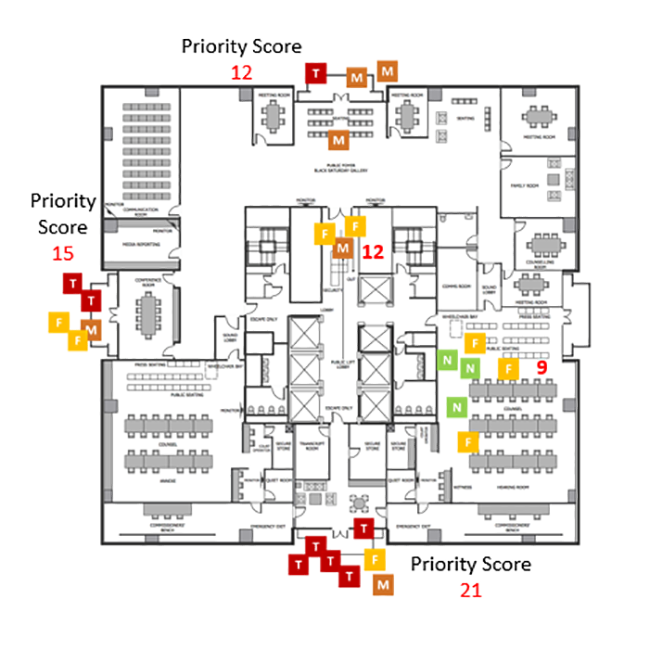
The first step is to understand your own historical performance. For businesses with a history of STF incidents, mapping is an easy way to visualize where they have occurred and their relative severity. The process starts by utilizing the previous 1-3 years of incident data to gather the location of each STF occurrence. Diagram each incident on a map and color code for severity.
Once incidents are mapped, prioritize each area by assigning a severity value to each injury. For example, a low severity report such as a near-miss would have a value of (1), first aid (2), medical only (3), and lost time (4). Add up the assigned values in each area to determine a priority score. Scores help focus prevention plans and support resource justification to leadership.
With prioritized locations identified, look for trends in activities, time of day, season, surface type or condition, surface transitions, awareness, and footwear. Review these trends to further narrow down your prevention efforts in these locations. The next step is to get out to each location to evaluate and understand what hazards may be present.
Hazard mapping focuses on traditional proactive techniques to identify site hazards that could likely cause injury. Hazards include raised sidewalk seams, potholes, drainage, or areas of frequent thaw/refreeze, and foreign objects in a walkway, just to name a few. Mapping these hazards and determining the exposure frequency produces a visual representation. A picture is worth 1000 words!
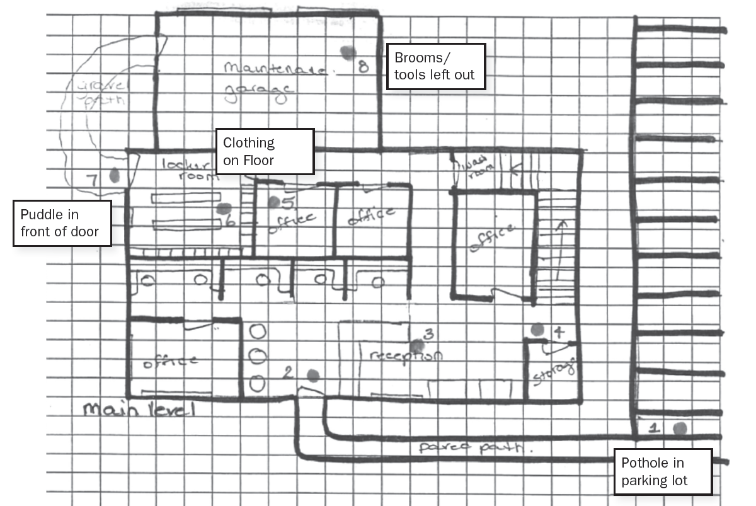
Comparing the hazard and incident maps helps to better prioritize and focus preventive actions so they become more effective. If surface hazards and prior incidents are in similar areas, then these areas should be prioritized. If controls are in place but incidents still occur a reevaluation is required. As a best practice, develop a plan to address each hazard focusing on both short and long-term corrective actions. Assigning champions to each corrective action and establishing completion due dates are also great ways to manage expectations and performance.
Best practices as we approach winter:
- Develop a snow and ice management plan detailing when plowing is required and frequency of surface treatment.
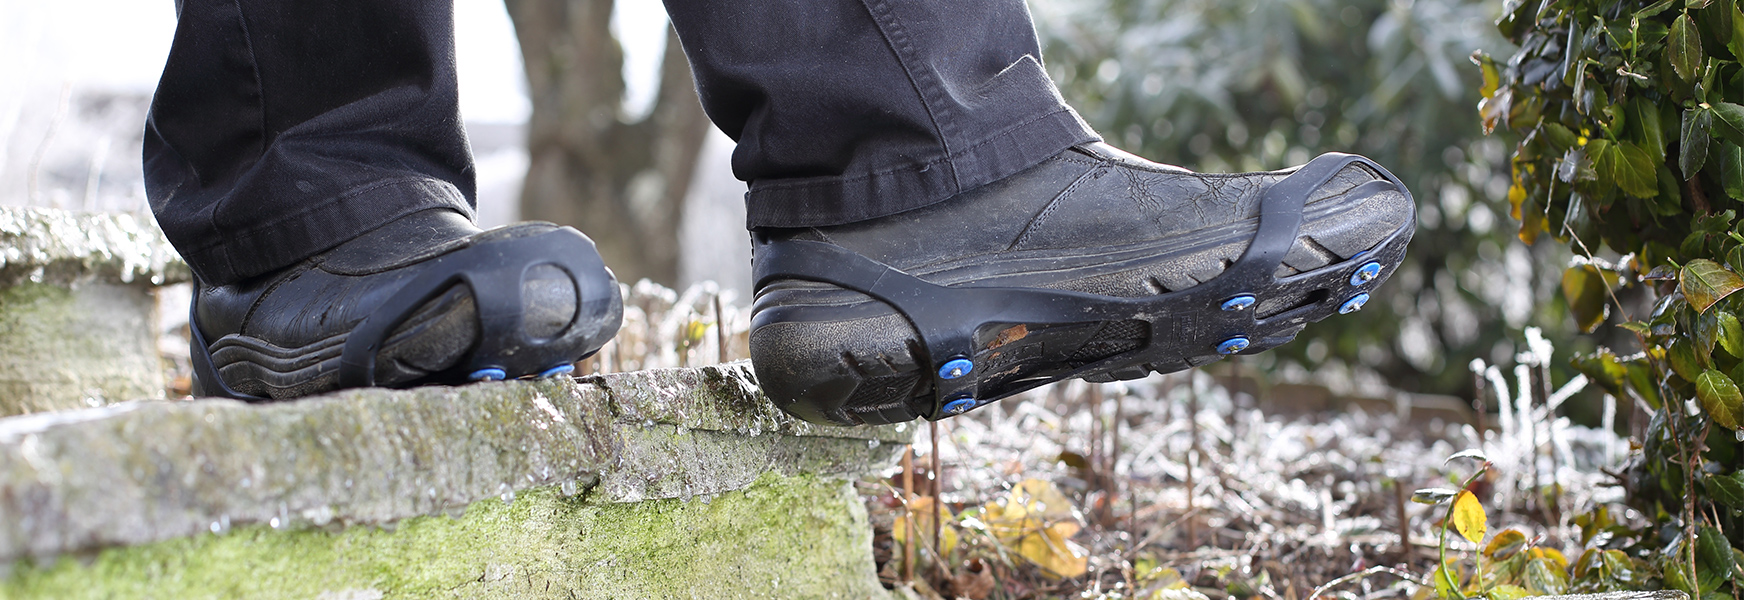
- Consider establishing a footwear policy and using traction enhancers when walking/working outside in slippery conditions or traveling between buildings. Some examples:
- Slip over Shoe - www.Winterwalking.com
- Yak Trax - https://yaktrax.implus.com/
- Boot Block - Low Profile, easy on/off boot block.
- Provide employees with a sand/salt fill station where recycled water bottles can be filled and kept in cars to provide traction when entering and exiting vehicles.
- Ensure storm drains are clear of debris.
- Provide ice melt and shovels at entrances and loading docks and encourage usage when appropriate.
- Have maintenance check walkways hourly when temperatures are 37°F or colder.
- Use snow melt liberally in shaded areas where ice buildup is more likely.
MEMIC policyholders can learn more about STF prevention by attending our free webinar, “Inspect What You Expect to Prevent Slips and Falls” on December 10, 2020 at 10:00 EST. Click here to register.
References:
1Bureau of Labor Statistics (2020). TABLE R4. Number of nonfatal occupational injuries and illnesses involving days away from work by industry and selected events or exposures leading to injury or illness, private industry, 2018
2Hazard Mapping | Injury and Illness Prevention Programs | Training from the NJ Work Environmental Council: https://www.osha.gov/sites/default/files/2018-11/fy12_sh-23529-12_HazardMappingManual.pdf
3Hazard Mapping and MSDs | https://oshwiki.eu/wiki/Hazard_mapping_and_MSDs
4OH&S Risk Mapping Tool for injury prevention | Workers’ Compensation Board of Nova Scotia | http://www.worksafeforlife.ca/portals/worksafeforlife/Comms-Publication-OHS%20Risk%20Mapping%20Tool.pdf?ver=2017-03-15-100223-570
Authored by Scott Valorose and Adam Levesque